This is part 2 of the MinIO setup guide. Today I want to take a look at the configuration of Prometheus, for the MinIO metrics. Never used it before, so we will see how this works out.
Let’s begin.
MinIO Client
Installation
We will start with the MinIO client installation.
Grab the binary from the MinIO repository with curl. This will also create a folder in your home directory.
minio :: ~ » curl https://dl.min.io/client/mc/release/linux-amd64/mc --create-dirs -o $HOME/minio-binaries/mc
Set the execution permissions for the binary.
minio :: ~ » chmod +x $HOME/minio-binaries/mc
Create Alias
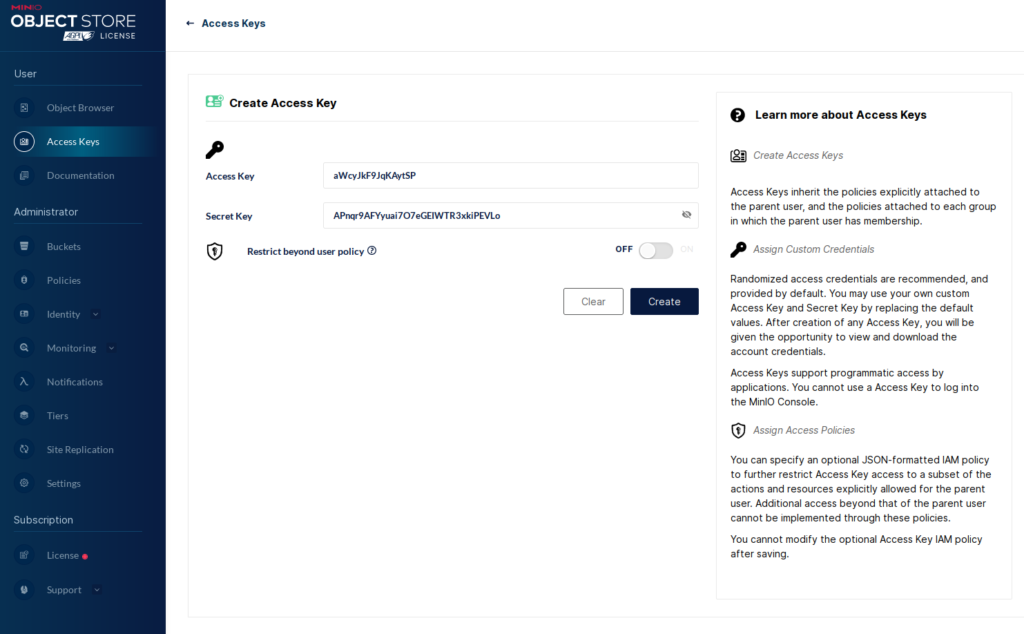
Now we can create an “alias” for the MinIO server. For this, we need an access key.

Next, we can create the alias with “mc”.
minio :: ~ » cd minio-binaries
minio :: minio-binaries » ./mc alias set MINIO https://minio.example.net:9000 aWcyJkF9JqKAytSP APnqr9AFYyuai7O7eGEIWTR3xkiPEVLo
If you get a certificate validation error, you can use the “–insecure” flag. Keep in mind that you have to use that flag every time you use the “mc” command with that alias.
minio :: minio-binaries » ./mc --insecure alias set MINIO https://minio.example.net:9000 aWcyJkF9JqKAytSP APnqr9AFYyuai7O7eGEIWTR3xkiPEVLo
Now that we have the alias, we can generate a Prometheus config. Copy the output.
minio :: minio-binaries » ./mc admin prometheus generate MINIO
scrape_configs:
- job_name: minio-job
  bearer_token: eyJhbGciOiJIUzUxMiIsInR5cCI6IkpXVCJ9.eyJpc3MiOiJwcm9tZXRoZXVzIiwic3ViIjoiYVdjeUprRjlKcUtBeXRTUCIsImV4cCI6NDgyNzIxMjM5OX0.H5IPqLmOermXOKSRA3evviQIvM0sYqqXT9jx-Vp6bhxoB5z3dgspa5SJFdwCS1aIQASYlGu8EzAr_qYA8nJq6g
  metrics_path: /minio/v2/metrics/cluster
  scheme: https
  static_configs:
  - targets: ['minio.example.net:9000']
Prometheus configuration
Configuration File
We need to create a yaml file for the Prometheus server. We can freely choose the location for it, I will create it in the /opt/prometheus folder.
Paste the output we generated earlier into the new file. You might want to change the “job_name” in case you have multiple MinIO servers you want to monitor. Just make sure you input the same name in the minio configuration file later.
minio :: ~ » mkdir /opt/prometheus
minio :: ~ » sudo vim /opt/prometheus/prometheus.yml
global:
  scrape_interval: 15s

scrape_configs:
- job_name: minio-job
  bearer_token: eyJhbGciOiJIUzUxMiIsInR5cCI6IkpXVCJ9.eyJpc3MiOiJwcm9tZXRoZXVzIiwic3ViIjoiYVdjeUprRjlKcUtBeXRTUCIsImV4cCI6NDgyNzIxMjM5OX0.H5IPqLmOermXOKSRA3evviQIvM0sYqqXT9jx-Vp6bhxoB5z3dgspa5SJFdwCS1aIQASYlGu8EzAr_qYA8nJq6g
  metrics_path: /minio/v2/metrics/cluster
  scheme: https
  static_configs:
  - targets: ['minio.example.net:9000']
### If you are using the "--insecure" flag, add this part
  tls_config:
    insecure_skip_verify: true
Now we can begin with the Prometheus installation. I will use the docker deployment option for this.
Docker Installation
First, we need to install docker.
Add the repository.
minio :: ~ » sudo dnf install yum-utils
minio :: ~ » sudo yum-config-manager --add-repo https://download.docker.com/linux/centos/docker-ce.repo
Next, we can install docker.
minio :: ~ » sudo yum install docker-ce docker-ce-cli containerd.io docker-compose-plugin
Enable and start the docker service.
minio :: ~ » sudo systemctl enable docker ; sudo systemctl start docker
To have persistent metric data, let’s create a volume for Prometheus.
minio :: ~ » sudo docker volume create prometheus-data
Now we can pull and run the Prometheus container. We also add the path to the configuration file and assign the volume.
minio :: ~ » sudo docker run -d -p 9090:9090 --name prometheus --restart=always -v /opt/prometheus/prometheus.yml:/etc/prometheus/prometheus.yml \
--volume prometheus-data:/prometheus prom/prometheus
After a few seconds, it should be up and running.
minio :: ~ » sudo docker ps
CONTAINER ID   IMAGE             COMMAND                  CREATED      STATUS      PORTS                                       NAMES
b2d401ff7cfa   prom/prometheus   "/bin/prometheus --c…"   9 days ago   Up 9 days   0.0.0.0:9090->9090/tcp, :::9090->9090/tcp   prometheus
We also need to open the ports.
fedora-kde :: ~ » sudo firewall-cmd --add-port 9090/tcp --permanent
fedora-kde :: ~ » sudo firewall-cmd --reload
WebUI
On the WebUI of Prometheus, we can check the status of the job.
Here is an example with an error.

And here, when it’s working.

This would be enough if we just wanted to use the “mc” client. But I want to access the metrics from the WebUI. For this, we need to add 2 more lines to the end of the MinIO configuration file. Make sure that the job ID fits with the generated output. The ID is the job_name you might have changed earlier.
minio :: ~ » sudo vim /etc/default/minio
MINIO_PROMETHEUS_URL="http://minio.example.net:9090"
MINIO_PROMETHEUS_JOB_ID="minio-job"
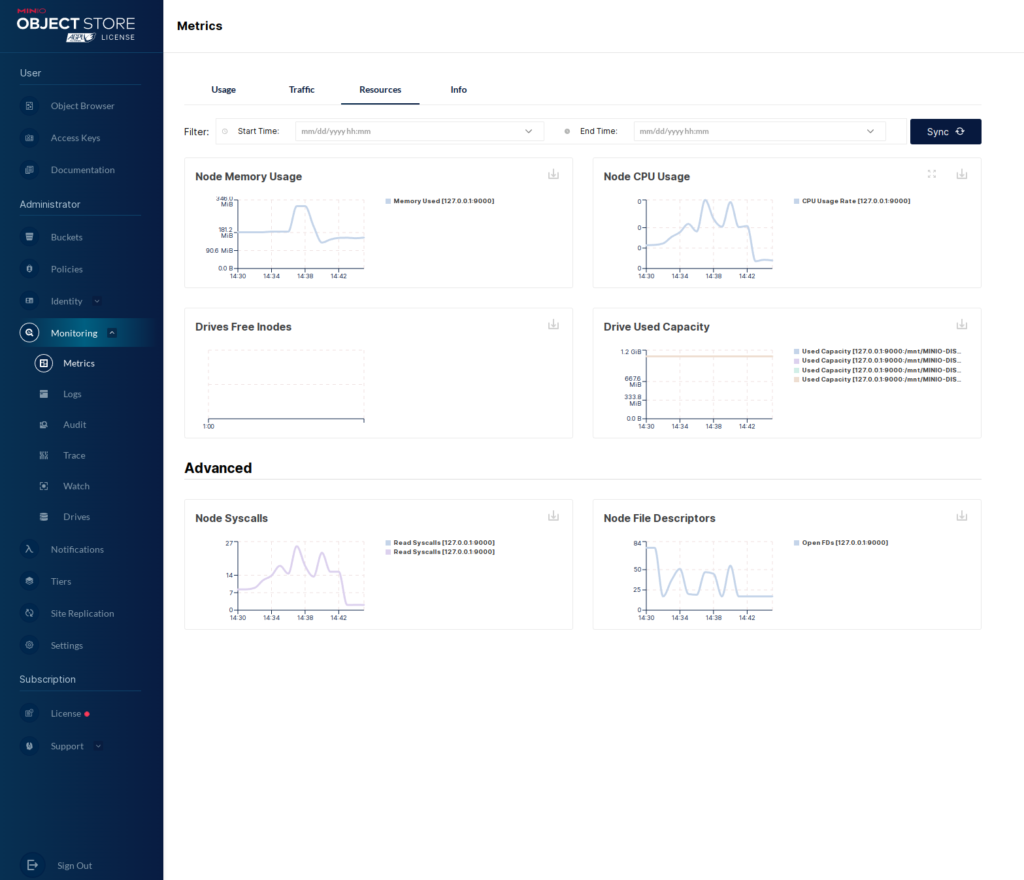
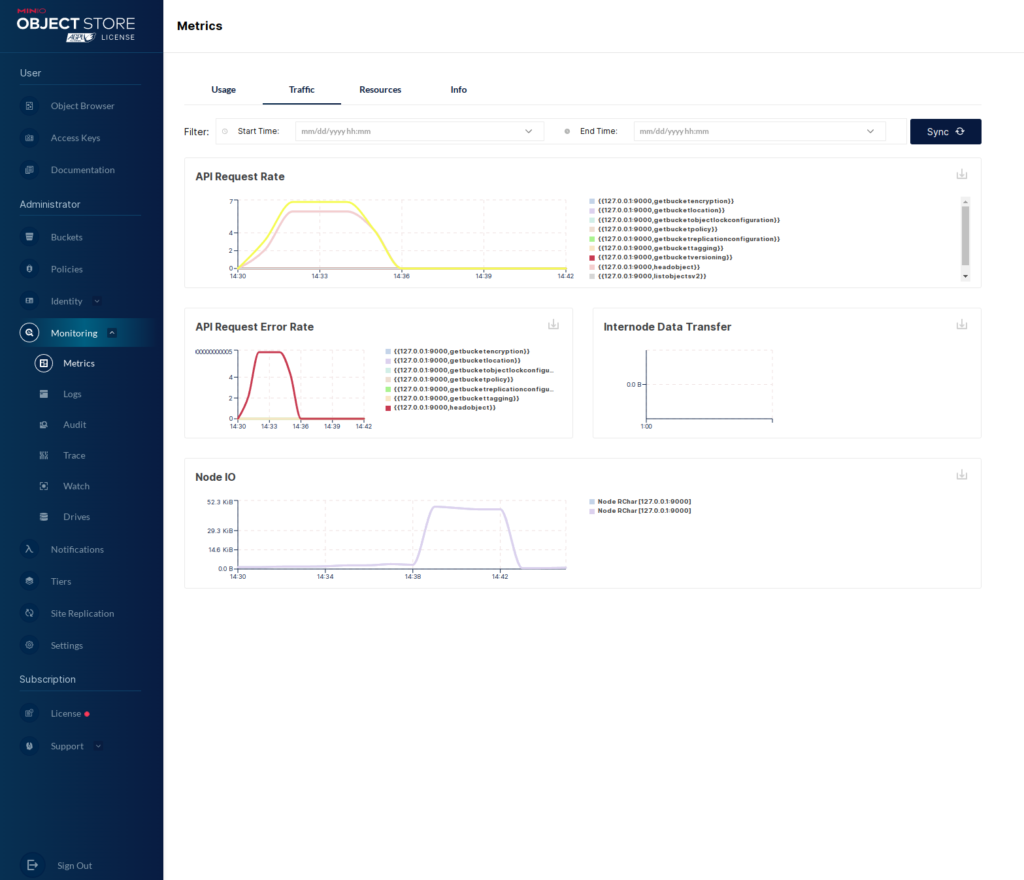
Now we can see the “Usage” metrics in the WebUI.


As I said, we could also access this information via the “mc” client. Let’s take a quick look at that.
Add Certificate to trusted
If you have an untrusted certificate, then the “–insecure” flag won’t work. I still get an error message. So, we add the self-signed certificate to the trusted store.
Copy the certificate we created in part 1 to the PKI folder.
minio :: ~ » cp /home/minio-user/.minio/certs/p* /etc/pki/ca-trust/source/anchors/
Next, update the ca trust store.
minio :: ~ » sudo update-ca-trust extract
Now we should be able to execute the “mc” command. This will give a raw output.
fedora-kde :: minio-binaries » ./mc admin prometheus metrics MINIO
...
# HELP minio_node_syscall_write_total Total write SysCalls to the kernel. /proc/[pid]/io syscw
# TYPE minio_node_syscall_write_total counter
minio_node_syscall_write_total{server="127.0.0.1:9000"} 3535
# HELP minio_notify_current_send_in_progress Number of concurrent async Send calls active to all targets
# TYPE minio_notify_current_send_in_progress gauge
minio_notify_current_send_in_progress{server="127.0.0.1:9000"} 0
# HELP minio_s3_requests_incoming_total Volatile number of total incoming S3 requests
# TYPE minio_s3_requests_incoming_total gauge
minio_s3_requests_incoming_total{server="127.0.0.1:9000"} 0
# HELP minio_s3_requests_rejected_auth_total Total number S3 requests rejected for auth failure
# TYPE minio_s3_requests_rejected_auth_total counter
minio_s3_requests_rejected_auth_total{server="127.0.0.1:9000"} 0
# HELP minio_s3_requests_rejected_header_total Total number S3 requests rejected for invalid header
# TYPE minio_s3_requests_rejected_header_total counter
minio_s3_requests_rejected_header_total{server="127.0.0.1:9000"} 0
# HELP minio_s3_requests_rejected_invalid_total Total number S3 invalid requests
...
That’s it for the basic setup.
Till next time.